A very common view of the stock market is that of a very risky, volatile place, more resembling a casino than being a proper place where you should put your money. Especially the two stock market crashes of the 2000s have done a lot to increase doubt about investments in the stock market. This is a dangerous misconception, as it might lead people to place their money in much more dangerous places (e.g, mortage bonds or the like) that are sold as being safer. In the following I will try to convince you that a diverse portfolio (especially some kind of index tracking fund) is actually quite a safe thing.
Still I want to express a word of caution. Obviously there is no such thing as absolute safety and you can loose money in the stock market, regardless of how clever you are. But this holds true for any possessions - money under the mattress can be rendered worthless by hyperinflation and a property can be taken from you by a revolution and so forth. It is all a matter of probability. Therefore I will not take any responsibility for losses you incur.
So assume you have invested in an index tracking fund, following the S&P 500 index. As you are a responsible investor, you have only put money there that you could live without. The good thing about not needing the money is, that you can wait through a crisis. The question is, what is the possibility to wait worth? In fact, quite a lot. Assuming you have made your investment at the worst possible point in time since the existence of the S&P 500, what would be the best annual return rate you could sell it for within the next 5 year period? It is -3.98% (buying on September 1st, 2000 and selling on August 3rd, 2005). That's not good, but also not that bad for the absolute worst case. What if you had 10 years? Then the number is 0.32%. This means if you have 10 years to wait, you can would have always been able to sell your fund without loss (if we ignore inflation). And if you are willing to wait up to 20 years? It is 5.11%. So in any 20 year period in the existence of the S&P 500, you would have found a point where to get your money back with an annual return of 5%.
These are of course worst case numbers. If we remove the worst 1% of cases and are willing to wait 20 years, the annual return rate we can expect rises to 8.01%. I.e. if the least you are willing to make is 8% per year and you know you can wait up to 20 years to get your money you would have been able to get that in 99% of the cases. To make this a little more graphical, in the following you see the worst case annual return rates you would have gotten away with associated with the maximum number of years you would have needed to wait. The red line are the absolute worst cases, the blue line are the cases where the worst 1% are removed.
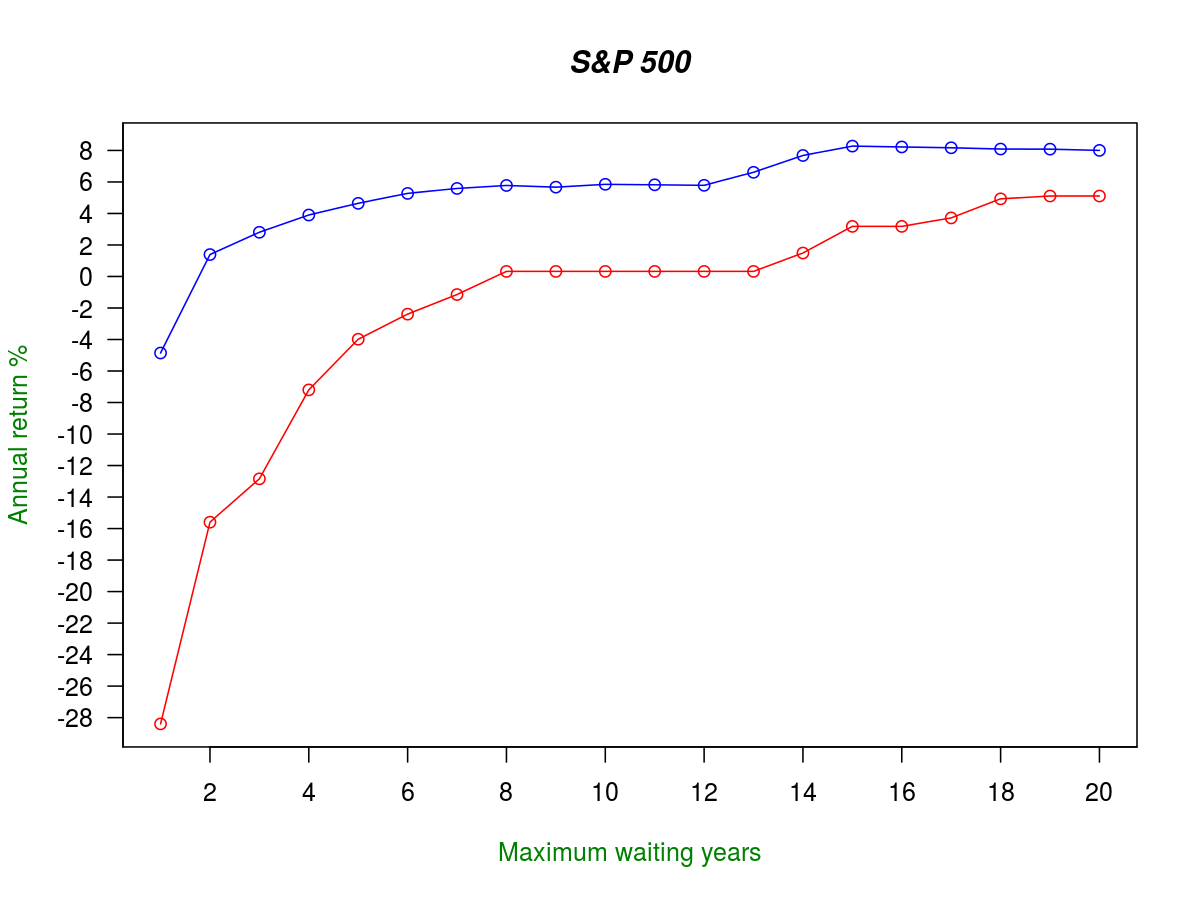
This is good news for your private retirement planning. Because when investing some money in some S&P 500 tracking fund every month for 40 years, you should be able to withdraw the money within the last 10 years with an annual return of 5% (very likely more). Try find another (non shady) retirement plan with a similar performance.
No matter what you are saving the money for, the strategy you need to follow is:
- Think: How long can you survive without the money?
- Set a realistic goal return rate. E.g., if you can wait 10 years, this can be 5.5%
- When you want to withdraw the money and your annual return so far is below your goal rate, wait until you reach it.
The overall morale is, that rather than thinking of the stock market as risky, it makes more sense to think of your money there as potentially locked for some time. The important part is to be willing to wait and stick to your goal return rate. You are only allowed to sell, once that return rate is reached. This might be tough when the stock market goes berserk, but as pointed out by the data it will pay out.
In the following are the graphs for some other indices than the S&P 500.
NASDAQ Composite
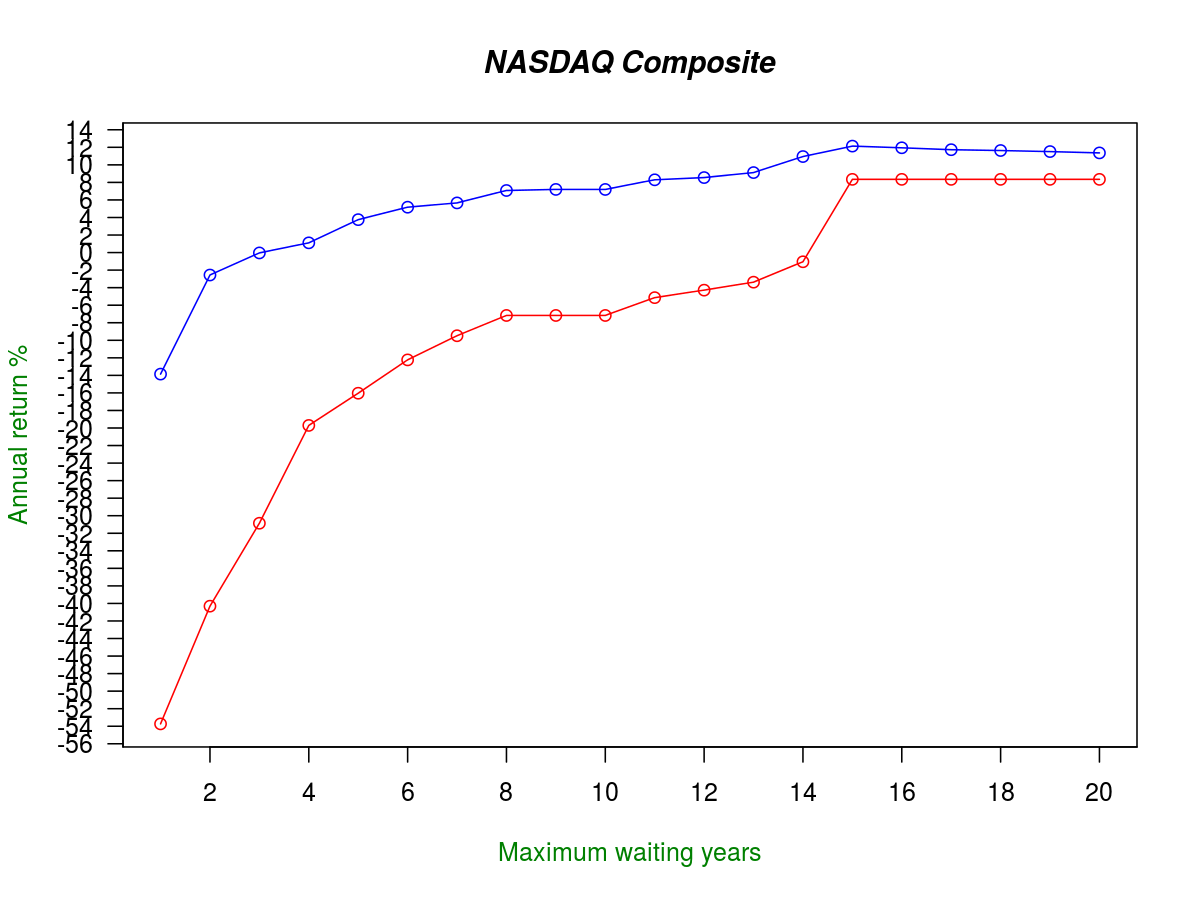
The NASDAQ Composite is an index closely related to technology companies. As these are more volatile, there are very low worst cases for small waiting times. But if you are willing to wait long enough you can also expect higher annual returns.
FTSE 100
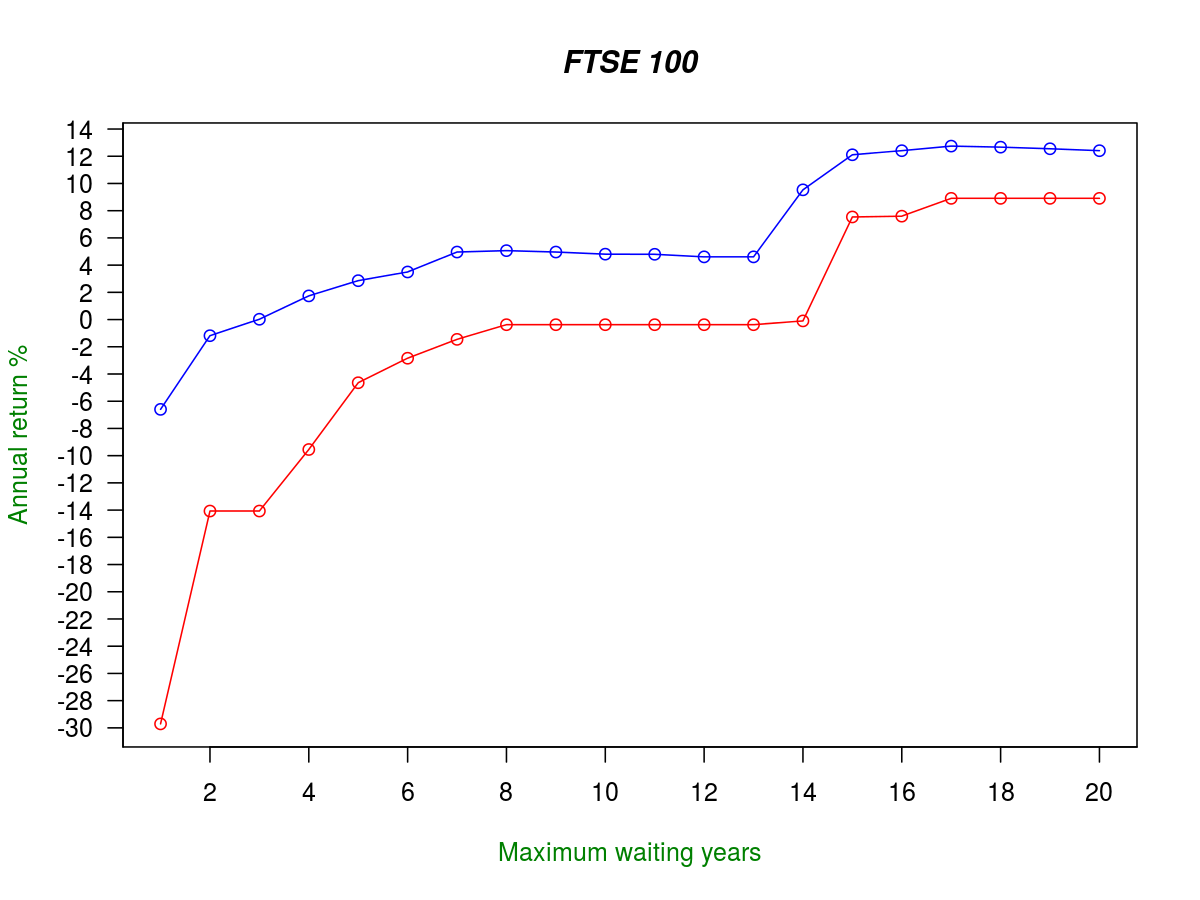
The FTSE 100 is a European Index, for the 100 companies at the London Stock Exchange with the highest market capitalization. The image is similar to the S&P 500 - when you are willing to wait for 10 years you can expect 4% of annual return. Note that the index exists since 1984, meaning that there haven't been a lot of 20 year periods yet. Therefore the higher waiting times are less reliable.
DAX
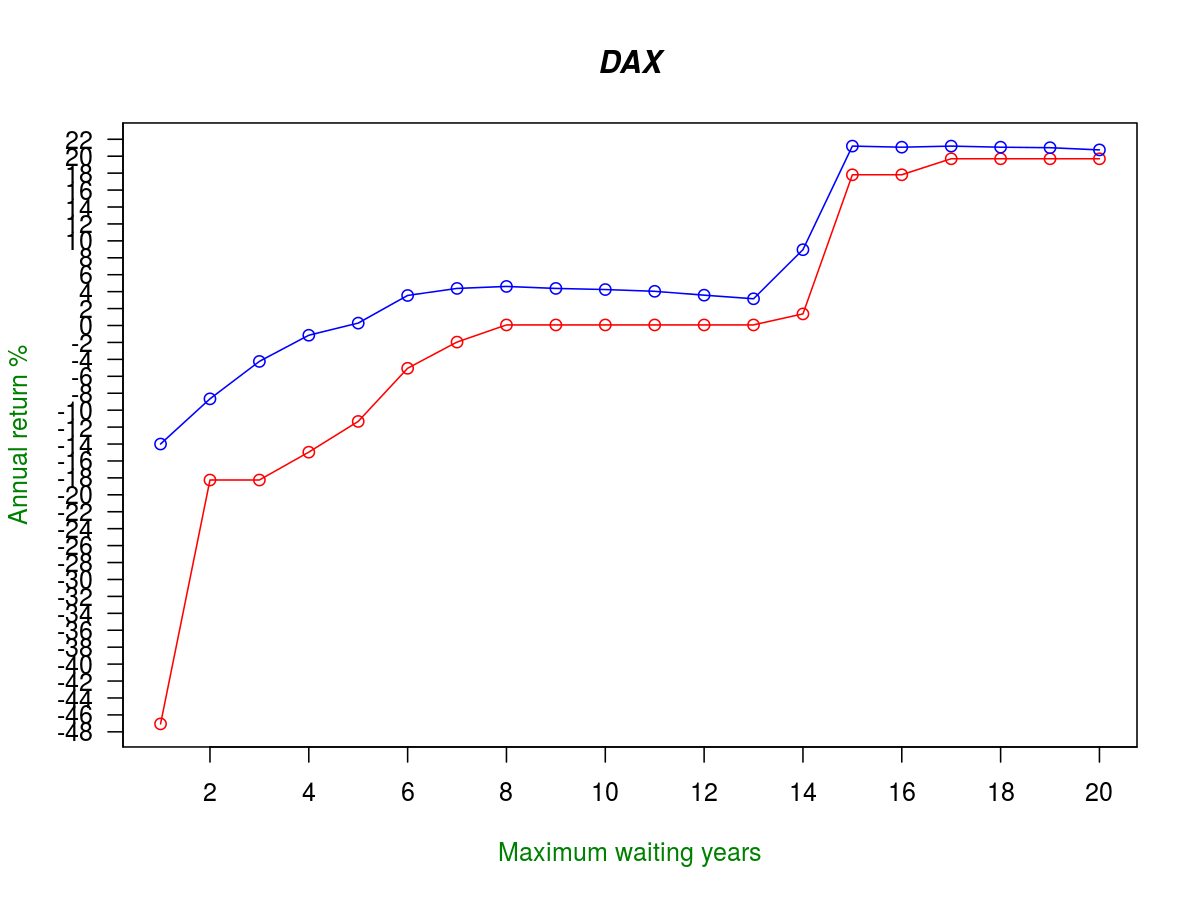
The DAX represents 30 major German companies. Note again that the higher waiting times are again unreliable as the index only exists since 1988.
Nikkei 225
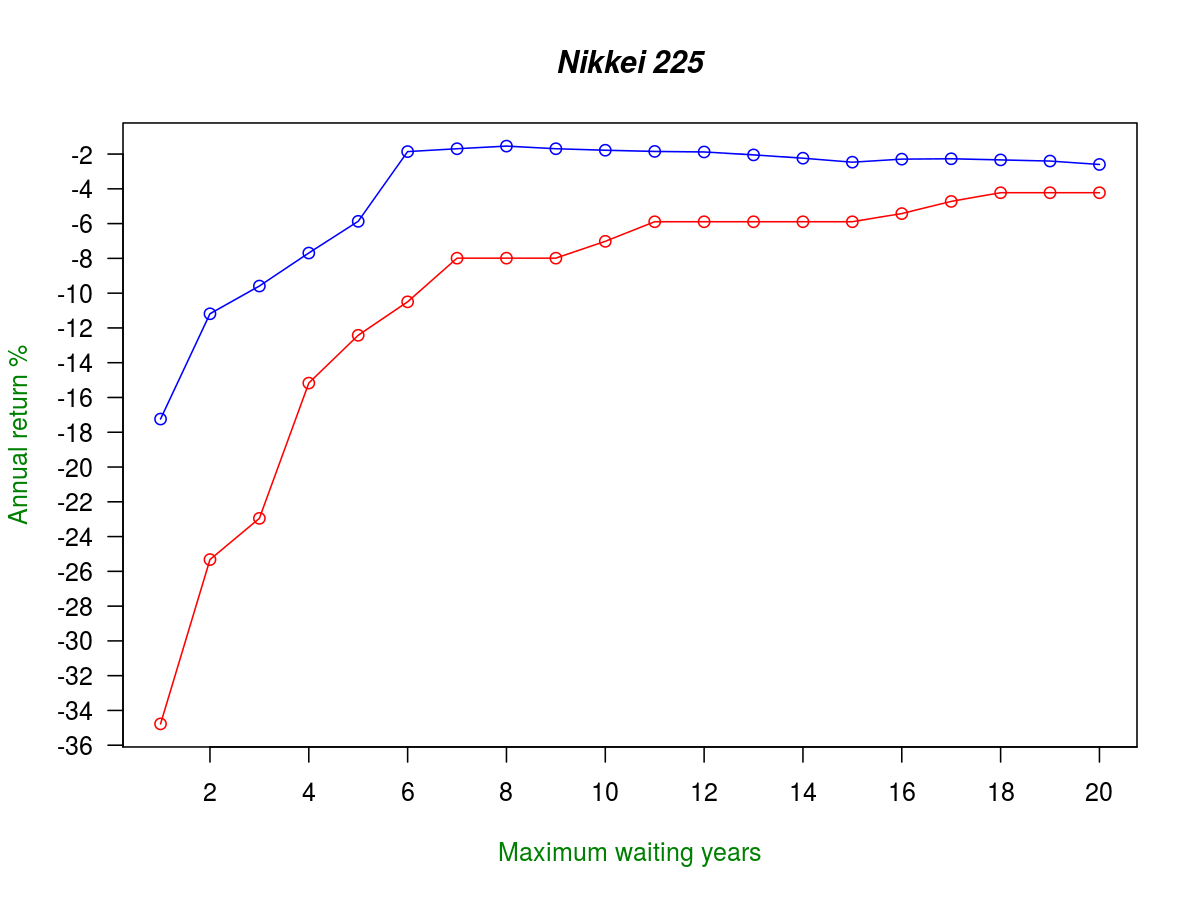
The Nikkei 225 is the only black sheep among the indices I have looked at. As Japans economy has been struggling for quite some time now, you might not have been able to get your money back in the last 20 years. This case should also be a warning not to rely on a to narrow index, that can suffer from a single struggling economy.
The data as tables
Here are the data points from the graphs in table form.
The absolute worst cases:
| Years to wait | S&P 500 | NASDAQ C. | FTSE 100 | DAX | Nikkei 225 |
|---|---|---|---|---|---|
| 1 | -28.4 | -53.73 | -29.71 | -47.06 | -34.77 |
| 2 | -15.59 | -40.31 | -14.07 | -18.25 | -25.32 |
| 3 | -12.84 | -30.85 | -14.07 | -18.25 | -22.95 |
| 4 | -7.2 | -19.7 | -9.55 | -14.96 | -15.17 |
| 5 | -3.98 | -16.03 | -4.64 | -11.33 | -12.42 |
| 6 | -2.39 | -12.23 | -2.84 | -5.05 | -10.5 |
| 7 | -1.14 | -9.48 | -1.45 | -1.95 | -7.99 |
| 8 | 0.32 | -7.17 | -0.37 | 0.07 | -7.99 |
| 9 | 0.32 | -7.17 | -0.37 | 0.07 | -7.99 |
| 10 | 0.32 | -7.17 | -0.37 | 0.07 | -7.02 |
| 11 | 0.32 | -5.14 | -0.37 | 0.07 | -5.89 |
| 12 | 0.32 | -4.28 | -0.37 | 0.07 | -5.89 |
| 13 | 0.32 | -3.37 | -0.37 | 0.07 | -5.89 |
| 14 | 1.49 | -1.05 | -0.1 | 1.37 | -5.89 |
| 15 | 3.18 | 8.35 | 7.54 | 17.81 | -5.89 |
| 16 | 3.18 | 8.35 | 7.6 | 17.81 | -5.42 |
| 17 | 3.72 | 8.35 | 8.91 | 19.7 | -4.72 |
| 18 | 4.93 | 8.35 | 8.91 | 19.7 | -4.22 |
| 19 | 5.11 | 8.35 | 8.91 | 19.7 | -4.22 |
| 20 | 5.11 | 8.35 | 8.91 | 19.7 | -4.22 |
And with the worst 1% removed:
| Years to wait | S&P 500 | NASDAQ C. | FTSE 100 | DAX | Nikkei 225 |
|---|---|---|---|---|---|
| 1 | -4.86 | -13.85 | -6.6 | -14 | -17.24 |
| 2 | 1.39 | -2.55 | -1.18 | -8.66 | -11.18 |
| 3 | 2.81 | -0.04 | 0.02 | -4.24 | -9.59 |
| 4 | 3.9 | 1.11 | 1.74 | -1.15 | -7.69 |
| 5 | 4.64 | 3.76 | 2.86 | 0.28 | -5.87 |
| 6 | 5.27 | 5.18 | 3.5 | 3.55 | -1.86 |
| 7 | 5.59 | 5.66 | 4.96 | 4.38 | -1.69 |
| 8 | 5.78 | 7.08 | 5.07 | 4.62 | -1.54 |
| 9 | 5.67 | 7.2 | 4.96 | 4.38 | -1.69 |
| 10 | 5.85 | 7.2 | 4.81 | 4.25 | -1.78 |
| 11 | 5.82 | 8.3 | 4.8 | 4.04 | -1.85 |
| 12 | 5.79 | 8.55 | 4.61 | 3.59 | -1.88 |
| 13 | 6.61 | 9.12 | 4.61 | 3.16 | -2.05 |
| 14 | 7.68 | 10.95 | 9.53 | 8.96 | -2.24 |
| 15 | 8.28 | 12.14 | 12.11 | 21.2 | -2.47 |
| 16 | 8.22 | 11.95 | 12.41 | 21.07 | -2.29 |
| 17 | 8.17 | 11.73 | 12.75 | 21.2 | -2.27 |
| 18 | 8.09 | 11.64 | 12.67 | 21.07 | -2.33 |
| 19 | 8.08 | 11.52 | 12.55 | 21.01 | -2.4 |
| 20 | 8.01 | 11.37 | 12.41 | 20.75 | -2.6 |
Afterword
Remember that these analyzes are all based on past data. It is possible that all this might not extend into the future due to unforeseeable circumstances. But as I said before, there is no way to have 100% safety. But as you have seen the stock market can actually be one of the safer (and most profitable) places where to park your money.
Header photo by George Rex
Data by Yahoo Finance
comments powered by Disqus